A recent Harvard Business Review article, The Political Issues Board Directors care Most About, identified the economy as the number one issue for global board directors. The economy is very important to both for-profit and non-profit companies and organisations. For example, when there is high unemployment, the demand for many companies’ goods and services will fall and revenues and profits will drop. At the same time there will be increased demands for assistance from non-profits such as St Vincent de Paul. Also, the state of the economy affects the costs faced by both for-profit companies and non-profits. For example, when the economy is going well and the jobs market is tight, wage rates tend to increase at a faster rate than usual. Furthermore, economic conditions affect interest rates, as interest rates tend to be lower when economic conditions are weak and higher when they are stronger.
So any board director should understand the current state of the economy and the economic outlook. And, ideally, directors should understand any relevant “leading” indicators providing advanced warning of future changes in economic conditions, such as building approvals in the construction industry. How can directors gain this economic understanding? A good start would be to regularly read publications (or their related websites) such as the Australian Financial Review or the Economist, arguably the world’s top economics and finance magazine. In these publications, you will find references to economic indicators such as GDP, the unemployment rate, and CPI inflation. Board directors should be acquainted with what these fundamental economic indicators mean and how to interpret them.
GDP
Let us begin with GDP, which stands for gross domestic product, a measure of the value of goods and services produced in an economy. This includes value added by all the economy’s industries, such as agriculture, manufacturing and services, as well as government activity, measured at the cost of provision. It includes goods and services produced both for domestic use and for export. It also represents the national income of Australians, as the value added during the production of goods and services is reflected in wages and profits. Australia’s GDP is currently around $1.6 trillion, which gets Australia into the G20 economies—i.e. the largest 20 economies in the world—at the back of the pack in around 19th place.[1]
GDP is obviously a very important indicator as it is a direct measure of the strength of the economy, and may thus be considered a “coincident” indicator. The importance of GDP is underlined by the Australian Treasurer, currently Scott Morrison, holding a regular press conference to accompany its release every quarter. The data are released just over two months after the quarter has ended. For example, June quarter GDP data, which cover the months of April to June, are released in early September. This means that GDP is not a very timely economic indicator, although it is the most comprehensive.
The rate of growth in “real” GDP is what is referred to as economic growth. By “real”, we mean that GDP has been adjusted for inflation. That is, the increase in the value of goods and services that is simply due to inflation (i.e. higher prices without any change in the quality or characteristics of goods or services) is removed. Technically, real GDP estimates are referred to as chain volume measures of GDP, due to the statistical technique that is used to construct them. The Australian economy grew 3.0% over the four quarters ending in the December quarter of 2015, in seasonally adjusted terms (Figure 1). This is referred to by analysts as a “through-the-year” growth rate. By seasonally adjusted, we mean that the Australian Bureau of Statistics (ABS) has applied a statistical procedure to adjust the original data for seasonal patterns such as the spike in consumer spending that occurs in the Christmas period, or the lower level of activity that typically occurs in the March quarter (January to March) due to people taking holidays in January.
Figure 1: GDP growth, through-the-year, seasonally adjusted, chain volume measures, Australia
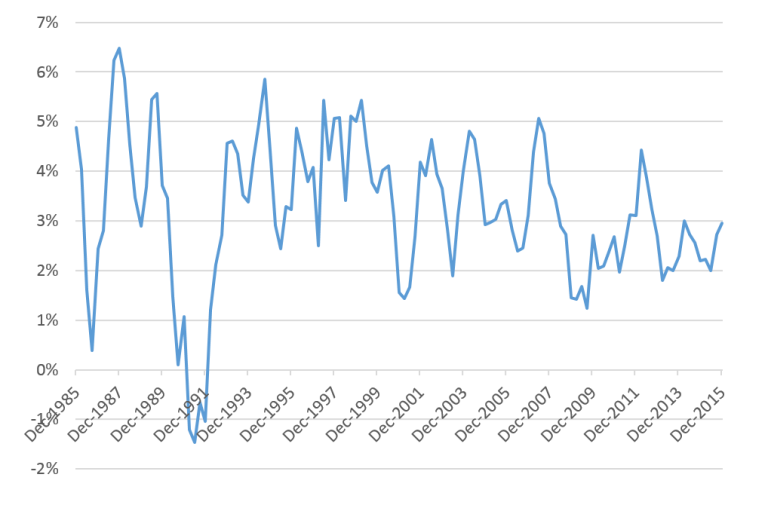
Source: ABS cat. no. 5206.0.
Australia’s recent GDP growth is considered slightly sub-trend or below average. To illustrate, since 2000, GDP growth has averaged at just below 3% per annum, but, in the last two years, growth has averaged around 2.5% per annum. This sub-trend growth has meant the unemployment rate has stayed in the vicinity of 6%.
The fluctuations in GDP and changes in the rate of economic growth define what is called the business cycle, over which the economy typically moves from expansion to peak, to recession to trough, and then in to recovery and expansion again. A recession is unofficially and somewhat imperfectly defined as two consecutive quarters of negative economic growth (i.e. GDP growth). By this definition, Australia last had a recession a quarter century ago in 1991.
Unemployment rate
The unemployment rate, often referred to as the jobless rate in the press, is the percentage of the labour force that is unemployed. The labour force is the sum of people employed, either full-time or part-time, and people unemployed, who are not currently working and are actively seeking work. That is, the definition of unemployment is not related to whether someone is “on the dole” and receiving Newstart Allowance. The unemployment rate, and other important indicators such as the rate of employment or jobs growth, are estimated from data gathered by the ABS in its monthly Labour Force Survey of around 26,000 households across Australia.
The unemployment rate tends to increase sharply in recessions and other periods of weak economic growth—i.e. where any jobs growth is insufficient to provide enough jobs for new labour market entrants, such as school leavers or migrants, or re-entrants, such as women who may have taken a break from their careers to have children. For example, the unemployment rate increased to over 11% in the 1991 recession from around 6% prior to the recession. And during the global financial crisis (GFC), the unemployment rate increased to around 6%, up from around 4% before the crisis (Figure 2).
You may notice that, even though the unemployment rate tends to increase quickly, it does not come down so quickly, particularly if the recovery from a downturn is slow. It is sometimes said that “unemployment rate goes up in an elevator but comes down on an escalator.”
Figure 2: Unemployment rate, seasonally adjusted, Australia
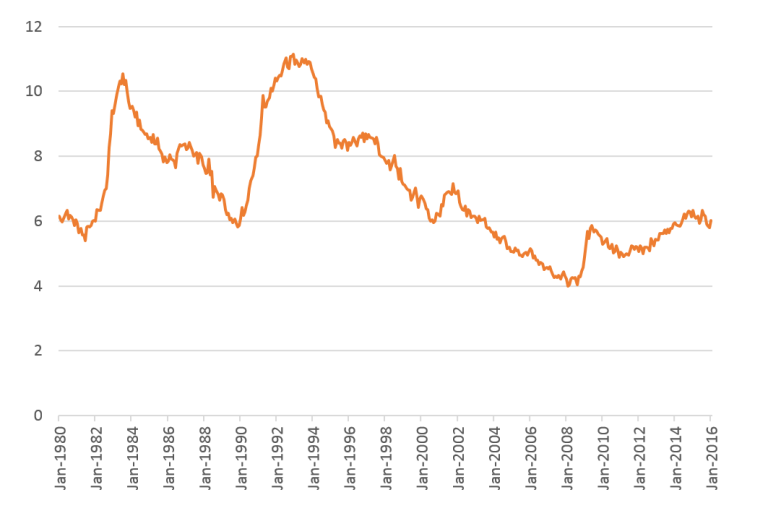
Source: ABS cat. no. 6202.0.
Another important indicator is the participation rate, which is the percentage of the population aged 15 and over that is in the labour force. Currently it is around 65%. The participation rate can change significantly over time, including over the business cycle. When economic conditions are strong, so called marginally-attached workers come back into the labour market looking for work. An example of a marginally attached worker would be a stay-at-home mother who might take a part-time job if a suitable one were available. The participation rate is important to consider in interpreting changes (or a lack of change) in the unemployment rate. For example, an economy may experience strong jobs growth, but the unemployment rate may not come down as much as expected, as the strong economic conditions could encourage new jobseekers into the market.
The unemployment and employment data are closely watched by the Reserve Bank of Australia (RBA) because of their timeliness, being released in the month after they are collected, and comprehensive coverage of the economy. That said, both do slightly lag GDP, and may be considered “lagging” indicators, because businesses do not immediately adjust employment levels in response to changing demand for their goods and services. For example, workers may not be immediately let go by a business that is struggling in a recession. A good discussion of the lagged relationship between the labour market and GDP is contained in the May 2014 Statement on Monetary Policy box Lags from Activity to the Labour Market.
As well as GDP and labour force data, the RBA monitors an extensive range of economic data, both domestic and international, to inform the advice it gives the RBA board on interest rates. In formulating its advice, the RBA has an inflation target in mind, a target that it attempts to achieve by setting interest rates. So the RBA is doing its best to determine what all the data it is monitoring—including data on the main indicators discussed in this note as well as items such as house prices, credit growth, and GDP growth in China and the US—mean for the future course of GDP, unemployment and inflation. The RBA’s inflation target, under an agreement with the Australian Government, is for the RBA to achieve 2-3% inflation over the business cycle.
Inflation
Inflation is measured by the percentage change in the Consumer Price Index (CPI). This is one of the most important indicators to monitor because it has a major influence on interest rates and borrowing costs. The CPI is calculated quarterly by the ABS based on the collection of price data for a typical “basket” of goods and services purchased by Australian households. It includes, among other things, items with volatile prices such as fuel prices, mortgage repayments, and bananas. Recall how Cyclone Yasi increased banana prices massively and the RBA had to look through the CPI increase due to this. Because of the presence of volatile items in the CPI basket, the RBA supplements the CPI inflation estimates with so-called core or underlying inflation measures—the trimmed mean and weighted median—that, broadly speaking, take the volatile items out of the calculation.
If inflation appears it will get out of the RBA’s 2-3% target range, the RBA will usually raise interest rates. It would cut interest rates when inflation appears contained within or is below the target range and economic conditions were weak. The RBA can consider GDP and unemployment in setting monetary policy and is not constrained to solely worrying about the inflation target. While the target is important, having it so it can be achieved over the business cycle, and does not have to be achieved every quarter, provides great flexibility to the RBA. For example, if the RBA cared only about inflation it might immediately hike interest rates to very high levels if inflation exceeded 3%, but the increase may be smaller if the RBA is worried about the consequences for unemployment. It might accept a more gradual path back toward the inflation target so that fewer people become unemployed.
The inflation targeting regime, which began in the mid-1990s (informally at first), has been very successful. Inflation in Australia has been much lower on average since it was introduced than in the two decades before (Figure 3).
Figure 3: CPI inflation, through-the-year growth in CPI, seasonally adjusted, Australia
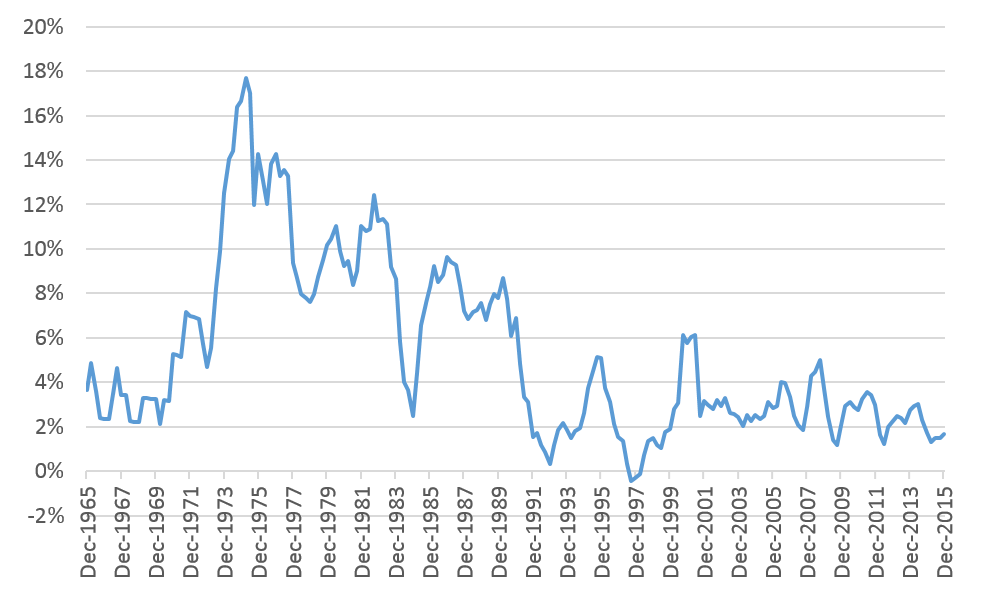
Source: ABS, cat. no. 6401.0.
The deliberations of the RBA Board in weighing up inflation, unemployment and external risks to the economy (e.g. a downturn in China) are summarised in the minutes of the monthly RBA Board meetings, which are published two weeks after the meeting. Other good sources for understanding the RBA’s thinking are the quarterly Statement on Monetary Policy and occasional speeches from RBA officials such as Governor Glenn Stevens, who famously referred to Sydney’s “crazy” house price growth in a 2015 speech in Brisbane.
The economic outlook chapters in the Federal and State budgets and mid-year updates are also useful, although less frequent than RBA commentary. Banks and consulting firms also produce a range economic analysis for their clients and public consumption, and commentators such as Saul Eslake, Chris Richardson, Bill Evans, Shane Oliver and Paul Bloxham, to name a few, are worth following. There is a wealth of economic analysis out there. Once you know the key terms, you are well placed to understand how the ever-changing economy affects your company or organisation.
Other indicators
This note has discuss several basic economic indicators that board directors should pay attention to, namely GDP, labour force data such as the unemployment rate and employment growth, and CPI inflation. GDP and CPI inflation are coincident indicators of the state of the economy, while the labour force data are often considered to be lagging indicators, as movements in them can lag movements in GDP by at least one quarter.
Directors should also make themselves aware of relevant leading indicators. Directors interested in understanding the future outlook across the economy would be interested in business confidence data, and the NAB Business Survey is typically considered the most reliable at the national level.
The economy-wide macroeconomic indicators should be supplemented by indicators relevant to the particular industry the company or organisation operates in, particularly any leading indicators that provide some advance warning of future conditions in the particular industry. Some examples of other relevant indicators are provided below.
- A hotel resort could look at ABS and Tourism Research Australia data on domestic and international visitor numbers and expenditure patterns, as well as the exchange rate, which is of crucial importance to any business exporting to or importing from overseas.
- A private school board could monitor data on share market performance and consumer confidence as they may be leading indicators of the capacity of parents to pay school fees and avoid falling into arrears on payments.
- A company in the construction industry should consider building approvals data, which is a leading indicator of construction activity.
- Businesses in which employees do a lot of interstate or international travel should pay attention to the oil price—currently at very low levels—because it is a major influence on the cost of flights.
In summary, board directors can get a better understand of the industry they are operating in and future opportunities and risks by paying attention to relevant economic data. There are plenty of resources available that can help directors do that, and some suggested ones to begin with are listed below.
Resources
ABS website: www.abs.gov.au
RBA chart pack, which is an excellent reference source of economic statistics, both domestic and international: http://www.rba.gov.au/chart-pack/index.html
RBA information on monetary policy including Board minutes & Statement on Monetary Policy: http://www.rba.gov.au/monetary-policy/
NAB Business Survey: http://business.nab.com.au/tag/business-survey/
Australian Government Budget, including economic outlook: http://www.budget.gov.au/
Tourism Research Australia data: http://www.tra.gov.au/research.html
[1] Callaghan, M., 2015, “Does it matter if Australia is no longer among the top 20 largest economies?”, Lowy Interpreter, http://www.lowyinterpreter.org/post/2015/02/18/Does-it-matter-if-Australia-is-no-longer-among-the-top-20-largest-economies.aspx.
Gene Tunny is a Specialist Adviser at Effective Governance and Principal, Adept Economics.